


Directors and Officers
Directors
(Unit: persons)
| FY2023 | FY2024 | FY2025 | |||||||
|---|---|---|---|---|---|---|---|---|---|
| Total | Male | Female | Total | Male | Female | Total | Male | Female | |
| Our Corporation | 8 | 6 | 2 | 8 | 6 | 2 | 11 | 9 | 2 |
| Ratio | 100.00% | 75.00% | 25.00% | 100.00% | 75.00% | 25.00% | 100.00% | 81.80% | 18.20% |
As of the end of June
Our Directors by Age
(Unit: persons)
| FY2023 | FY2024 | FY2025 | ||||||||||
|---|---|---|---|---|---|---|---|---|---|---|---|---|
| Total | Under 30 | 30-49 | Over 50 | Total | Under 30 | 30-49 | Over 50 | Total | Under 30 | 30-49 | Over 50 | |
| Our Corporation | 8 | 0 | 0 | 8 | 8 | 0 | 0 | 8 | 11 | 0 | 0 | 11 |
| Ratio | 100.00% | 0.00% | 0.00% | 100.00% | 100.00% | 0 | 0 | 100.00% | 100.00% | 0 | 0 | 100.00% |
As of the end of June
Our Percentage of Non-Japanese Directors
(Unit: persons)
| FY2023 | FY2024 | FY2025 | ||||
|---|---|---|---|---|---|---|
| Total | Non-Japanese | Total | Non-Japanese | Total | Non-Japanese | |
| Our Corporation | 8 | 1 | 8 | 1 | 11 | 1 |
| Ratio | 100.00% | 12.50% | 100.00% | 12.50% | 100.00% | 9.10% |
As of the end of June
Board Members
(Unit: persons)
| FY2023 | FY2024 | FY2025 | |||||||
|---|---|---|---|---|---|---|---|---|---|
| Total | Male | Female | Total | Male | Female | Total | Male | Female | |
| Our Corporation | 24 | 22 | 2 | 24 | 22 | 2 | 26 | 23 | 3 |
| Ratio | 100.00% | 91.70% | 8.30% | 100.00% | 91.70% | 8.30% | 100.00% | 88.50% | 11.50% |
As of the end of June
Board Members by Age
(Unit: persons)
| FY2023 | FY2024 | FY2025 | ||||||||||
|---|---|---|---|---|---|---|---|---|---|---|---|---|
| Total | Under 30 | 30-49 | Over 50 | Total | Under 30 | 30-49 | Over 50 | Total | Under 30 | 30-49 | Over 50 | |
| Our Corporation | 24 | 0 | 0 | 24 | 24 | 0 | 0 | 24 | 26 | 0 | 0 | 26 |
| Ratio | 100.00% | 0.00% | 0.00% | 100.00% | 100.00% | 0.00% | 0.00% | 100.00% | 100.00% | 0 | 0 | 100.00% |
As of the end of June
Percentage of Non-Japanese Board Members
(Unit: persons)
| FY2023 | FY2024 | FY2025 | ||||
|---|---|---|---|---|---|---|
| Total | Non-Japanese | Total | Non-Japanese | Total | Non-Japanese | |
| Our Corporation | 24 | 1 | 24 | 1 | 26 | 1 |
| Ratio | 100.00% | 4.20% | 100.00% | 4.20% | 100.00% | 3.80% |
Employees
By Gender Ratio / Contract Status
(Unit: persons)
| FY2020 | FY2021 | FY2022 | FY2023 | FY2024 | FY2025 | |||||||||||||||||||||||||||||
|---|---|---|---|---|---|---|---|---|---|---|---|---|---|---|---|---|---|---|---|---|---|---|---|---|---|---|---|---|---|---|---|---|---|---|
| Male | Ratio | Female | Ratio | Total | Male | Ratio | Female | Ratio | Total | Male | Ratio | Female | Ratio | Total | Male | Ratio | Female | Ratio | Total | Male | Ratio | Female | Ratio | Total | Male | Ratio | Female | Ratio | Total | |||||
| Umios group | Employees | 6,249 | 56.30% | 4,858 | 43.70% | 11,107 | 7,252 | 55.30% | 5,865 | 44.70% | 13,117 | 6,892 | 55.80% | 5,460 | 44.20% | 12,352 | 7,147 | 55.60% | 5,696 | 44.30% | 12,843 | 7,009 | 55.90% | 5,522 | 44.00% | 12,531 | 6,960 | 55.80% | 5,494 | 44.10% | 12,454 | |||
| Managers | 1,667 | 89.00% | 206 | 11.00% | 1,873 | 1,752 | 87.00% | 261 | 13.00% | 2,013 | 1,662 | 87.00% | 248 | 12.90% | 1,910 | 1,715 | 85.40% | 292 | 14.50% | 2,007 | 1,696 | 85.10% | 295 | 14.80% | 1,991 | 1,693 | 84.40% | 311 | 15.50% | 2,004 | ||||
| General Employees | 4,582 | 49.60% | 4,652 | 50.40% | 9,234 | 5,500 | 49.50% | 5,604 | 50.50% | 11,104 | 5,230 | 50.00% | 5,212 | 49.90% | 10,442 | 5,432 | 50.10% | 5,404 | 49.80% | 10,836 | 5,313 | 50.40% | 5,227 | 49.50% | 10,540 | 5,267 | 50.40% | 5,183 | 49.60% | 10,450 | ||||
| Temporary Employees | 4,838 | 36.30% | 8,504 | 63.70% | 13,342 | 4,546 | 35.00% | 8,430 | 65.00% | 12,976 | 4,659 | 34.50% | 8,828 | 65.40% | 13,487 | 4,828 | 36.00% | 8,552 | 63.90% | 13,380 | 4,571 | 35.40% | 8,330 | 64.50% | 12,901 | 4,647 | 35.60% | 8,399 | 64.30% | 13,046 | ||||
| Japan | Employees | 4,252 | 72.90% | 1,578 | 27.10% | 5,830 | 4,356 | 73.00% | 1,614 | 27.00% | 5,970 | 4,344 | 72.80% | 1,621 | 27.10% | 5,965 | 4,292 | 71.10% | 1,739 | 28.80% | 6,031 | 4,240 | 70.30% | 1,787 | 29.60% | 6,027 | 4,215 | 69.50% | 1,844 | 30.40% | 6,059 | |||
| Managers | 1,464 | 95.70% | 65 | 4.30% | 1,529 | 1,520 | 95.50% | 72 | 4.50% | 1,592 | 1,471 | 95.50% | 68 | 4.40% | 1,539 | 1,482 | 94.30% | 89 | 5.60% | 1,571 | 1,453 | 94.10% | 91 | 5.80% | 1,544 | 1,435 | 93.30% | 103 | 6.70% | 1,538 | ||||
| General Employees | 2,788 | 64.80% | 1,513 | 35.20% | 4,301 | 2,836 | 64.80% | 1,542 | 35.20% | 4,378 | 2,873 | 64.90% | 1,553 | 35.00% | 4,426 | 2,810 | 63.00% | 1,650 | 37.00% | 4,460 | 2,787 | 62.10% | 1,696 | 37.80% | 4,483 | 2,780 | 61.40% | 1,741 | 38.50% | 4,521 | ||||
| Temporary Employees | 2,141 | 38.40% | 3,439 | 61.60% | 5,580 | 2,140 | 38.00% | 3,496 | 62.00% | 5,636 | 2,107 | 38.60% | 3,340 | 61.30% | 5,447 | 2,030 | 38.80% | 3,202 | 61.20% | 5,232 | 2,051 | 39.40% | 3,147 | 60.50% | 5,198 | 2,056 | 40.10% | 3,070 | 59.80% | 5,126 | ||||
| Umios co. | Employees | 1,257 | 77.90% | 357 | 22.10% | 1,614 | 1,262 | 76.00% | 399 | 24.00% | 1,661 | 1,221 | 74.10% | 426 | 25.80% | 1,647 | 1,200 | 73.10% | 440 | 26.80% | 1,640 | 1,176 | 71.20% | 475 | 28.70% | 1,651 | 1,171 | 69.30% | 518 | 30.60% | 1,689 | |||
| Managers | 594 | 94.70% | 33 | 5.30% | 627 | 601 | 94.90% | 32 | 5.10% | 633 | 594 | 94.80% | 32 | 5.10% | 626 | 605 | 93.90% | 39 | 6.00% | 644 | 588 | 92.60% | 47 | 7.40% | 635 | 562 | 91.00% | 55 | 8.90% | 617 | ||||
| General Employees | 663 | 67.20% | 324 | 32.80% | 987 | 661 | 64.30% | 367 | 35.70% | 1,028 | 627 | 61.40% | 394 | 38.50% | 1,021 | 595 | 59.70% | 401 | 40.20% | 996 | 588 | 57.80% | 428 | 42.10% | 1,016 | 609 | 56.80% | 463 | 43.10% | 1,072 | ||||
| Temporary Employees | 1,037 | 49.60% | 1,053 | 50.40% | 2,090 | 883 | 44.20% | 1,116 | 55.80% | 1,999 | 853 | 45.30% | 1,028 | 54.60% | 1,881 | 772 | 44.80% | 951 | 55.10% | 1,723 | 818 | 46.20% | 950 | 53.70% | 1,768 | 837 | 46.40% | 966 | 53.50% | 1,803 | ||||
| Domestic group | Employees | 2,995 | 71.00% | 1,221 | 29.00% | 4,216 | 3,094 | 71.80% | 1,215 | 28.20% | 4,309 | 3,123 | 72.30% | 1,195 | 27.60% | 4,318 | 3,092 | 70.40% | 1,299 | 29.50% | 4,391 | 3,064 | 70.00% | 1,312 | 29.90% | 4,376 | 3,044 | 69.60% | 1,326 | 30.30% | 4,370 | |||
| Managers | 870 | 96.50% | 32 | 3.50% | 902 | 919 | 95.80% | 40 | 4.20% | 959 | 877 | 96.00% | 36 | 3.90% | 913 | 877 | 94.60% | 50 | 5.30% | 927 | 865 | 95.10% | 44 | 4.80% | 909 | 873 | 94.70% | 48 | 5.20% | 921 | ||||
| General Employees | 2,125 | 64.10% | 1,189 | 35.90% | 3,314 | 2,175 | 64.90% | 1,175 | 35.10% | 3,350 | 2,246 | 65.90% | 1,159 | 34.00% | 3,405 | 2215 | 63.90% | 1249 | 36.00% | 3,464 | 2199 | 63.40% | 1268 | 36.50% | 3,467 | 2,171 | 62.90% | 1,278 | 37.00% | 3,449 | ||||
| Temporary Employees | 1,104 | 31.60% | 2,386 | 68.40% | 3,490 | 1,257 | 34.60% | 2,380 | 65.40% | 3,637 | 1,254 | 35.10% | 2,312 | 64.80% | 3,566 | 1258 | 35.80% | 2251 | 64.10% | 3,509 | 1233 | 35.90% | 2197 | 64.00% | 3,430 | 1,219 | 36.60% | 2,104 | 63.30% | 3,323 | ||||
| Overseas | Employees | 1,997 | 37.80% | 3,280 | 62.20% | 5,277 | 2,896 | 40.50% | 4,251 | 59.50% | 7,147 | 2,548 | 39.80% | 3,839 | 60.10% | 6,387 | 2,855 | 41.90% | 3,957 | 58.00% | 6,812 | 2,769 | 42.50% | 3,735 | 57.40% | 6,504 | 2,745 | 42.90% | 3,650 | 57.00% | 6,395 | |||
| Managers | 203 | 59.00% | 141 | 41.00% | 344 | 232 | 55.10% | 189 | 44.90% | 421 | 191 | 51.40% | 180 | 48.50% | 371 | 233 | 53.40% | 203 | 46.50% | 436 | 243 | 54.30% | 204 | 45.60% | 447 | 258 | 55.30% | 208 | 44.60% | 466 | ||||
| General Employees | 1,793 | 36.40% | 3,139 | 63.60% | 4,932 | 2,664 | 39.60% | 4,062 | 60.40% | 6,726 | 2,357 | 39.10% | 3,659 | 60.80% | 6,016 | 2,622 | 41.10% | 3,754 | 58.80% | 6,376 | 2,526 | 41.70% | 3,531 | 58.30% | 6,057 | 2,487 | 41.90% | 3,442 | 58.00% | 5,929 | ||||
| Temporary Employees | 2,697 | 34.70% | 5,065 | 65.30% | 7,762 | 2,406 | 32.80% | 4,934 | 67.20% | 7,340 | 2,552 | 31.70% | 5,488 | 68.20% | 8,040 | 2,798 | 34.30% | 5,350 | 65.60% | 8,148 | 2,520 | 32.70% | 5,183 | 67.20% | 7,703 | 2,591 | 32.70% | 5,329 | 67.20% | 7,920 | ||||
| North America | Employees | 416 | 66.20% | 212 | 33.80% | 628 | 403 | 65.60% | 211 | 34.40% | 614 | 332 | 66.20% | 169 | 33.70% | 501 | 398 | 67.60% | 190 | 32.30% | 588 | 418 | 68.00% | 196 | 31.90% | 614 | 427 | 68.30% | 198 | 31.60% | 625 | |||
| Managers | 76 | 72.40% | 29 | 27.60% | 105 | 92 | 74.80% | 31 | 25.20% | 123 | 54 | 79.40% | 14 | 20.50% | 68 | 66 | 82.50% | 14 | 17.50% | 80 | 69 | 80.20% | 17 | 19.70% | 86 | 69 | 79.30% | 18 | 20.60% | 87 | ||||
| General Employees | 340 | 65.00% | 183 | 35.00% | 523 | 311 | 63.30% | 180 | 36.70% | 491 | 278 | 64.20% | 155 | 35.80% | 433 | 332 | 65.30% | 176 | 34.60% | 508 | 349 | 66.10% | 179 | 33.90% | 528 | 358 | 66.50% | 180 | 33.40% | 538 | ||||
| Temporary Employees | 651 | 72.80% | 243 | 27.20% | 894 | 566 | 65.50% | 298 | 34.50% | 864 | 283 | 72.30% | 108 | 27.60% | 391 | 374 | 75.80% | 119 | 24.10% | 493 | 360 | 76.10% | 113 | 23.80% | 473 | 406 | 73.20% | 148 | 26.70% | 554 | ||||
| Asia | Employees | 1,227 | 29.40% | 2,940 | 70.60% | 4,167 | 2,123 | 35.20% | 3,915 | 64.80% | 6,038 | 1,877 | 34.50% | 3,550 | 65.40% | 5,427 | 1,934 | 35.30% | 3531 | 64.60% | 5,465 | 1,814 | 35.40% | 3310 | 64.60% | 5,124 | 1,801 | 35.70% | 3,233 | 64.20% | 5,034 | |||
| Managers | 100 | 50.80% | 97 | 49.20% | 197 | 112 | 44.40% | 140 | 55.60% | 252 | 109 | 42.50% | 147 | 57.40% | 256 | 112 | 42.50% | 151 | 57.40% | 263 | 107 | 41.10% | 153 | 58.80% | 260 | 121 | 43.50% | 157 | 56.40% | 278 | ||||
| General Employees | 1,127 | 28.40% | 2,843 | 71.60% | 3,970 | 2,011 | 34.80% | 3,775 | 65.20% | 5,786 | 1,768 | 34.10% | 3,403 | 65.80% | 5,171 | 1822 | 35.00% | 3380 | 64.90% | 5,202 | 1707 | 35.00% | 3157 | 64.90% | 4,864 | 1,680 | 35.30% | 3,076 | 64.60% | 4,756 | ||||
| Temporary Employees | 1,935 | 28.90% | 4,760 | 71.10% | 6,695 | 1,721 | 27.30% | 4,572 | 72.70% | 6,293 | 2,193 | 29.20% | 5,301 | 70.70% | 7,494 | 2163 | 29.50% | 5168 | 70.50% | 7,331 | 1928 | 27.80% | 5007 | 72.20% | 6,935 | 1,952 | 27.40% | 5,151 | 72.50% | 7,103 | ||||
| Europe | Employees | 83 | 66.40% | 42 | 33.60% | 125 | 83 | 66.40% | 42 | 33.60% | 125 | 100 | 67.10% | 49 | 32.80% | 149 | 244 | 62.70% | 145 | 37.20% | 389 | 233 | 64.30% | 129 | 35.60% | 362 | 240 | 65.40% | 127 | 34.60% | 367 | |||
| Managers | 7 | 100.00% | 0 | 0.00% | 7 | 7 | 100.00% | 0 | 0.00% | 7 | 6 | 100.00% | 0 | 0.00% | 6 | 24 | 55.80% | 19 | 44.10% | 43 | 39 | 72.20% | 15 | 27.70% | 54 | 41 | 75.90% | 13 | 24.00% | 54 | ||||
| General Employees | 75 | 64.10% | 42 | 35.90% | 117 | 76 | 64.40% | 42 | 35.60% | 118 | 94 | 65.70% | 49 | 34.20% | 143 | 220 | 63.50% | 126 | 36.40% | 346 | 194 | 62.90% | 114 | 37.00% | 308 | 199 | 63.50% | 114 | 36.40% | 313 | ||||
| Temporary Employees | 30 | 32.60% | 62 | 67.40% | 92 | 40 | 38.50% | 64 | 61.50% | 104 | 31 | 28.90% | 76 | 71.00% | 107 | 57 | 49.10% | 59 | 50.80% | 116 | 25 | 49.00% | 26 | 50.90% | 51 | 30 | 52.60% | 27 | 47.30% | 57 | ||||
| Others※1 | Employees | 271 | 77.00% | 81 | 23.00% | 352 | 287 | 77.60% | 83 | 22.40% | 370 | 239 | 77.10% | 71 | 22.90% | 310 | 279 | 75.40% | 91 | 24.50% | 370 | 304 | 75.20% | 100 | 24.70% | 404 | 277 | 75.00% | 92 | 24.90% | 369 | |||
| Managers | 20 | 57.10% | 15 | 42.90% | 35 | 21 | 53.80% | 18 | 46.20% | 39 | 22 | 53.60% | 19 | 46.30% | 41 | 31 | 62.00% | 19 | 38.00% | 50 | 28 | 59.50% | 19 | 40.40% | 47 | 27 | 57.40% | 20 | 42.50% | 47 | ||||
| General Employees | 251 | 78.00% | 71 | 22.00% | 322 | 266 | 80.40% | 65 | 19.60% | 331 | 217 | 80.60% | 52 | 19.30% | 269 | 248 | 77.50% | 72 | 22.50% | 320 | 276 | 77.30% | 81 | 22.60% | 357 | 250 | 77.60% | 72 | 22.30% | 322 | ||||
| Temporary Employees | 81 | 100.00% | 0 | 0.00% | 81 | 79 | 100.00% | 0 | 0.00% | 79 | 45 | 93.70% | 3 | 6.20% | 48 | 204 | 98.00% | 4 | 1.90% | 208 | 207 | 84.80% | 37 | 15.10% | 244 | 203 | 98.50% | 3 | 1.40% | 206 | ||||
Scope of coverage: Employees of Umios Corporation (career-track and area employees excluding seconded employees and employees on leave)
※ The number of employees by gender for the entire group has been calculated since the end of March 2019.
※1 Austral Fisheries Pty Ltd. 、Maruha (N.Z.) Corporation Ltd. 、Taiyo Micronesia Corporation
As of the end of March
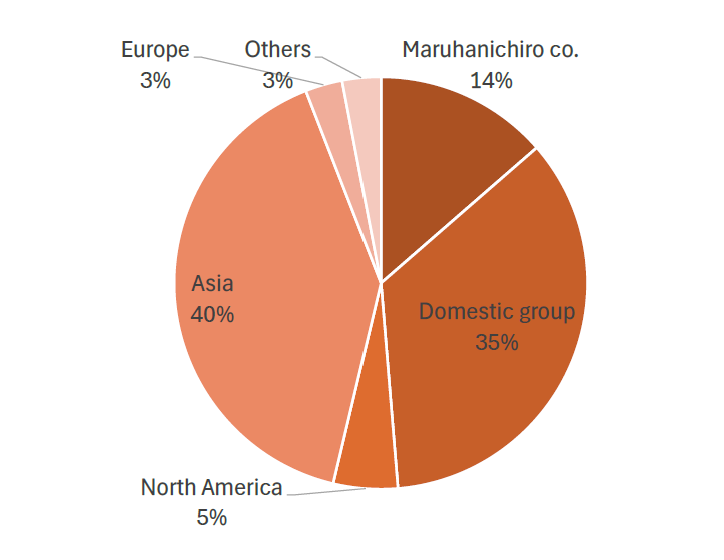
Ratio of employees by region
As of the end of March
Annual Salaries by Gender
(Unit: thousand yen)
| FY2022 | FY2023 | FY2024 | |||||||
|---|---|---|---|---|---|---|---|---|---|
| Male Average Salary (A) |
Female Average Salary (B) |
B/A | Male Average Salary (A) |
Female Average Salary (B) |
B/A | Male Average Salary (A) |
Female Average Salary (B) |
B/A | |
| Regular workers | 4,946 | 65.20% | 7,729 | 5,158 | 66.70% | 7,949 | 5,326 | 67.00% | |
| Irregular workers | 3,009 | 2,254 | 74.90% | 2,998 | 2,309 | 77.00% | 3,186 | 2,482 | 77.90% |
| All workers | 6,724 | 3,761 | 55.90% | 6,778 | 3,901 | 57.60% | 6,953 | 4,112 | 59.10% |
Scope of coverage: Employees of Umios Corporation
As of the end of March
Employees by Age Group
(Unit: persons)
| FY2022 | FY2023 | FY2024 | FY2025 | |||||||||
|---|---|---|---|---|---|---|---|---|---|---|---|---|
| Total | Male | Female | Total | Male | Female | Total | Male | Female | Total | Male | Female | |
| Under 30 | 325 | 197 | 128 | 319 | 186 | 133 | 354 | 201 | 153 | 372 | 203 | 169 |
| 30~39 | 338 | 218 | 120 | 304 | 198 | 106 | 283 | 181 | 102 | 335 | 194 | 141 |
| 40~49 | 502 | 400 | 102 | 517 | 402 | 115 | 530 | 393 | 137 | 524 | 376 | 148 |
| 50~59 | 480 | 405 | 75 | 498 | 412 | 86 | 487 | 402 | 85 | 498 | 400 | 98 |
| Total | 1,645 | 1,220 | 425 | 1,638 | 1,198 | 440 | 1,654 | 1,177 | 477 | 1,729 | 1,173 | 556 |
Scope of coverage: Employees of Umios Corporation (excluding employees on loan and employees on leave of absence)
As of the end of March
Number of Employees by Segment
(Unites: persons)
| FY2022 | FY2023 | FY2024 | FY2025 | ||||||||||
|---|---|---|---|---|---|---|---|---|---|---|---|---|---|
| Segment | Type of Employment | Total | Male | Female | Total | Male | Female | Total | Male | Female | Total | Male | Female |
| Fisheries Resources | Employees | 7,999 | 3,876 | 4,123 | 8,307 | 4,058 | 4,249 | 8,016 | 3,969 | 4,047 | 2,271 | 1,537 | 734 |
| Temporary Employees | 8,293 | 2,791 | 5,502 | 8,555 | 3,124 | 5,432 | 8,154 | 2,880 | 5,274 | 1,244 | 844 | 400 | |
| Processing | Employees | 3,044 | 2,009 | 1,035 | 1,212 | 769 | 443 | 1,174 | 741 | 433 | 5,801 | 2,397 | 3,404 |
| Temporary Employees | 5,072 | 1,780 | 3,292 | 1,791 | 736 | 1,055 | 1,857 | 783 | 1,074 | 8,658 | 2,676 | 5,982 | |
| Food Distribution | Employees | ー | ー | ー | ー | ー | ー | 2,006 | 1,313 | 693 | 3,020 | 2,041 | 979 |
| Temporary Employees | ー | ー | ー | ー | ー | ー | 2,715 | 812 | 1,903 | 2,932 | 1,000 | 1,932 | |
| Logistics | Employees | 826 | 674 | 152 | 854 | 679 | 175 | 832 | 661 | 171 | ー | ー | ー |
| Temporary Employees | 90 | 61 | 29 | 83 | 58 | 25 | 87 | 57 | 30 | ー | ー | ー | |
| Others | Employees | 120 | 90 | 30 | 2,002 | 1,325 | 677 | 7 | 5 | 2 | 829 | 654 | 175 |
| Temporary Employees | 7 | 2 | 5 | 2,874 | 878 | 1,996 | 0 | 0 | 0 | 109 | 80 | 29 | |
| Corporate | Employees | 363 | 243 | 120 | 468 | 316 | 152 | 496 | 320 | 176 | 533 | 331 | 202 |
| Temporary Employees | 66 | 25 | 41 | 76 | 32 | 44 | 88 | 39 | 49 | 103 | 47 | 56 | |
| Total | Employees | 12,352 | 6,892 | 5,460 | 12,843 | 7,147 | 5,696 | 12,531 | 7,009 | 5,522 | 12,454 | 6,960 | 5,494 |
| Temporary Employees | 13,528 | 4,659 | 8,869 | 13,379 | 4,828 | 8,552 | 12,901 | 4,571 | 8,330 | 13,046 | 4,647 | 8,399 | |
Scope of coverage: Employees of Umios Corporation
As of the end of March
Recruitment
Ratio of New Graduates and Mid-Career Men and Women
(Unit: persons)
| Total | Male | Female | ||
|---|---|---|---|---|
| New graduates | FY2020 | 75 | 47 | 28 |
| FY2021 | 58 | 35 | 23 | |
| FY2022 | 50 | 25 | 25 | |
| FY2023 | 86 | 41 | 45 | |
| FY2024 | 80 | 40 | 40 | |
| FY2025 | 95 | 49 | 46 | |
| Mid-career hires | FY2020 | 34 | 25 | 9 |
| FY2021 | 25 | 7 | 18 | |
| FY2022 | 39 | 23 | 16 | |
| FY2023 | 38 | 24 | 14 | |
| FY2024 | 45 | 31 | 14 | |
Scope of coverage: Employees of Umios
As of the end of March
Mid-Career Hires in FY2024 (Breakdown by Age Group)
(Unit: persons)
| Total | Male | Female | |
|---|---|---|---|
| Under30 | 16 | 11 | 5 |
| 30~39 | 25 | 18 | 7 |
| 40~49 | 2 | 0 | 2 |
| 50~59 | 2 | 2 | 0 |
| Total | 45 | 31 | 14 |
Scope of coverage: Employees of Umios
Employment Rate of the Physically Challenged
(Unit: %)
| FY2021 | FY2022 | FY2023 | FY2024 | 2025FY | |
|---|---|---|---|---|---|
| Ratio | 2 | 2.32 | 2.31 | 2.5 | 2.64 |
Scope of coverage: Employees of Umios
As of the first of April
Post-Retirement Reemployment
(Unit: persons)
| FY2023 | FY2024 | FY2025 | |||||||
|---|---|---|---|---|---|---|---|---|---|
| Total | Male | Female | Total | Male | Female | Total | Male | Female | |
| Persons | 42 | 29 | 13 | 52 | 34 | 18 | 56 | 40 | 16 |
Scope of coverage: Employees of Umios Corporation (career-track and area positions) *Including seconded employees.
As of the first of April
Data on Job Leavers
(Unites: persons)
| Mandatory retirement | Others | Total | Ratio of retirees | ||
|---|---|---|---|---|---|
| No. Job Leavers | FY2020 | 19 | 47 | 66 | 4.10% |
| FY2021 | 34 | 60 | 94 | 5.70% | |
| FY2022 | 32 | 55 | 87 | 5.30% | |
| FY2023 | 29 | 60 | 89 | 5.40% | |
| FY2024 | 42 | 63 | 105 | 6.40% | |
Employees of Umios Corporation (career-track and area positions)
As of the end of March
【A person who has retired from all positions】
| FY2020 | FY2021 | FY2022 | FY2023 | FY2024 | |||||||||||
|---|---|---|---|---|---|---|---|---|---|---|---|---|---|---|---|
| Total | Male | Female | Total | Male | Female | Total | Male | Female | Total | Male | Female | Total | Male | Female | |
| Under 30 | 15 | 11 | 4 | 25 | 20 | 5 | 25 | 23 | 2 | 29 | 16 | 13 | 24 | 16 | 8 |
| 30~39 | 11 | 6 | 5 | 13 | 9 | 4 | 10 | 7 | 3 | 14 | 11 | 3 | 12 | 10 | 2 |
| 40~49 | 3 | 1 | 2 | 4 | 2 | 2 | 5 | 5 | 0 | 8 | 8 | 0 | 6 | 6 | 0 |
| 50~59 | 4 | 3 | 1 | 5 | 5 | ー | 6 | 6 | 0 | 3 | 2 | 1 | 3 | 3 | 0 |
| Total | 33 | 21 | 12 | 47 | 36 | 11 | 46 | 41 | 5 | 54 | 37 | 17 | 45 | 35 | 10 |
Employees of Umios Corporation (career-track and area positions)
As of the end of March
Capacity building
Training costs and hours
| FY2022 | FY2023 | FY2024 | ||
|---|---|---|---|---|
| Total education and training related expenses (millions of yen) | 83 | 84 | 104 | |
| Training for management level (millions of yen) | For management leaders | 3.9 | 2.5 | 3.3 |
| For managers | 9.7 | 5.3 | 5.4 | |
| Management leader human resource development (millions of yen) | 14.6 | 13.7 | 14.3 | |
| Global human resource development (millions of yen) | 26.5 | 17 | 21.4 | |
| Training hours per employee (hours) | 16 | 16 | 10 | |
| Annual training investment per employee (millions of yen) | 5 | 5 | 5 | |
Employees of Umios Corporation (career-track and area positions)
Occupational Safety
Workers' Compensation
(Unit: persons)
| FY2022 | FY2023 | FY2024 | ||||
|---|---|---|---|---|---|---|
| Total | Temporary staff, etc. | Total | Temporary staff, etc. | Total | Temporary staff, etc. | |
| I. Number of deaths due to work-related injuriesWork-related injuries resulting in fatalities | 0 | 0 | 0 | 0 | 0 | 0 |
| II. Leading to Serious Consequences Number of Work-Related Injuries (excluding fatalities) |
38 | 10 | 25 | 7 | 29 | 3 |
| III. Number of work-related injuries subject torecord | 134 | 18 | 107 | 18 | 141 | 11 |
| IV. Main types of work-related injuries | (1) Falling over (2) Caught in or caught in (3) Crashing |
(1) Tumble (2) Crash (3) Cut/rub |
(1) Falling over (2) Getting stuck or entangled (3) Cutting, etc. |
(1) Falls (2) Trapped or entangled (3) Falls, etc. |
(1) Falling over (2) Cutting and rubbing (3) Pinching and entrapment |
(1) Contact with hot or cold objects (2) Recoil or unreasonable movement of operation (3) Others (1 each) |
| Frequency rate (%) | 2.95 | 2.93 | 3.17 | |||
| Intensity rate (%) | 0.06 | 0.05 | 0.04 | |||
Scope: Umios Group
As of the end of March
Number of workers covered by the occupational safety management system
| Offices | Number of workers (persons) | Ratio |
|---|---|---|
| New Ishinomaki Plant | 299 | 100% |
| Oe Plant | 474 | 100% |
| Shirataka Plant | 159 | 100% |
| Utsunomiya Plant | 223 | 100% |
| Gunma Plant | 387 | 100% |
| Shimonoseki Plant | 331 | 100% |
| Utsunomiya Production Section, Chemical BioDivision | 85 | 100% |
| Mori Production Section, Chemical Bio Division | 15 | 100% |
Scope: Umios co.
Average number of overtime hours, working hours, and annual paid leave
| FY2022 | FY2023 | FY2024 | |
|---|---|---|---|
| Total hours worked (hours)*1 | 2052 | 1980:47:00 | 1968:25:00 |
| Average overtime hours*2 | 17:41 | 17.28 | 17:24 |
| Average paid leave taken (days)*3 | 12 | 14 | 15 |
| Percentage of paid leave taken | 64% | 72% | 76% |
*1【Scope】Umios Co., Ltd. employees (career track and area positions)
*2【Scope】Umios Co., Ltd. employees (career track and area positions excluding seconded employees) Head office contract employees
*3【Scope】Umios Co., Ltd. employees *Not applicable if joining or leaving during the term, not granted, or on leave
*As of end of March
Percentage of unionized employees to all employees (percentage of employees with collective bargaining rights)
| FY2022 | FY2023 | FY2024 | |
|---|---|---|---|
| Labor union membership rate | 60.00% | 61.00% | 62.00% |
Scope of coverage: Umios Co., Ltd. employees (career track, area, and factory area positions)
*As of end of March
Work-life balance (WLB) related systems
Childcare leave
| FY2022 | FY2023 | FY2024 | ||||||||
|---|---|---|---|---|---|---|---|---|---|---|
| System Description | Total | Male | Female | Total | Male | Female | Total | Male | Female | |
| Number of employees taking maternity leave before | The maximum number of days grantedis 14 weeks. During the leave, aportion of wages is compensatedthrough the health insurance union. | ー | ー | 31 | ー | ー | 31 | ー | ー | 24 |
| Number of employees entitled to childcare leave | This is a system of leave until thechild turns 2 years old. Men can alsouse this system. | 79 | 48 | 31 | 74 | 42 | 32 | 54 | 30 | 24 |
| Number of employees taking childcare leave | 52 | 17 | 35 | 49 | 13 | 36 | 41 | 16 | 25 | |
| Rate of use | 65.80% | 35.40% | 112.90% | 66.20% | 31.00% | 112.50% | 75.90% | 53.30% | 104.20% | |
| Number of employees returning to work after childcare leave | 23 | 9 | 14 | 45 | 12 | 33 | 45 | 12 | 33 | |
| Short-term childcare leave | Leave of absence until the child turns2 years old. Up to 10 days of leavecan be taken with no reduction in pay. | 15 | 15 | ー | 10 | 10 | ー | 5 | 5 | ー |
| Spouse maternity leave system *Male employees with a spouse who had a child during the fiscal year |
29 | 29 | ー | 26 | 26 | ー | 17 | 17 | ー | |
| Childcare working hours system | System that allows employees to beexempted from working for up to 1hour and 40 minutes per day to carefor a child before the child enters thefourth grade of elementary school. | 92 | 0 | 92 | 96 | 0 | 96 | 107 | 0 | 107 |
*As of end of March
Other/Institutional
| FY2022 | FY2023 | FY2024 | |
|---|---|---|---|
| Child nursing care leave (days) | 34 | 52 | 65 |
| Number of Job Return System users | 2 | 1 | 0 |
| Flextime work system*1 (persons) | 1,660 | 1,580 | 1,589 |
| Nursing care leave system (persons) | 0 | 0 | 1 |
| Shorter working hours for nursing care (persons) | 0 | 0 | 0 |
| Telecommuting system (persons) | 1548 | 1601 | 1600 |
| Short-term nursing care leave system (persons) | 0 | 7 | 2 |
Scope: Employees of Umios Corporation (career track and area positions)
*1 : As of April 1
*As of the end of March, except for employees who work flex-time