


Reference materials
New Long-term Vision and Mid-term Management Plan For the ocean, for life 2027 (PDF: 2.15 MB / 33 p)
New Long-Term Vision
We will aim for sustainable growth under a new identity and transform itself into a "solution company" that co-creates value with various stakeholders and solves social issues through "food."
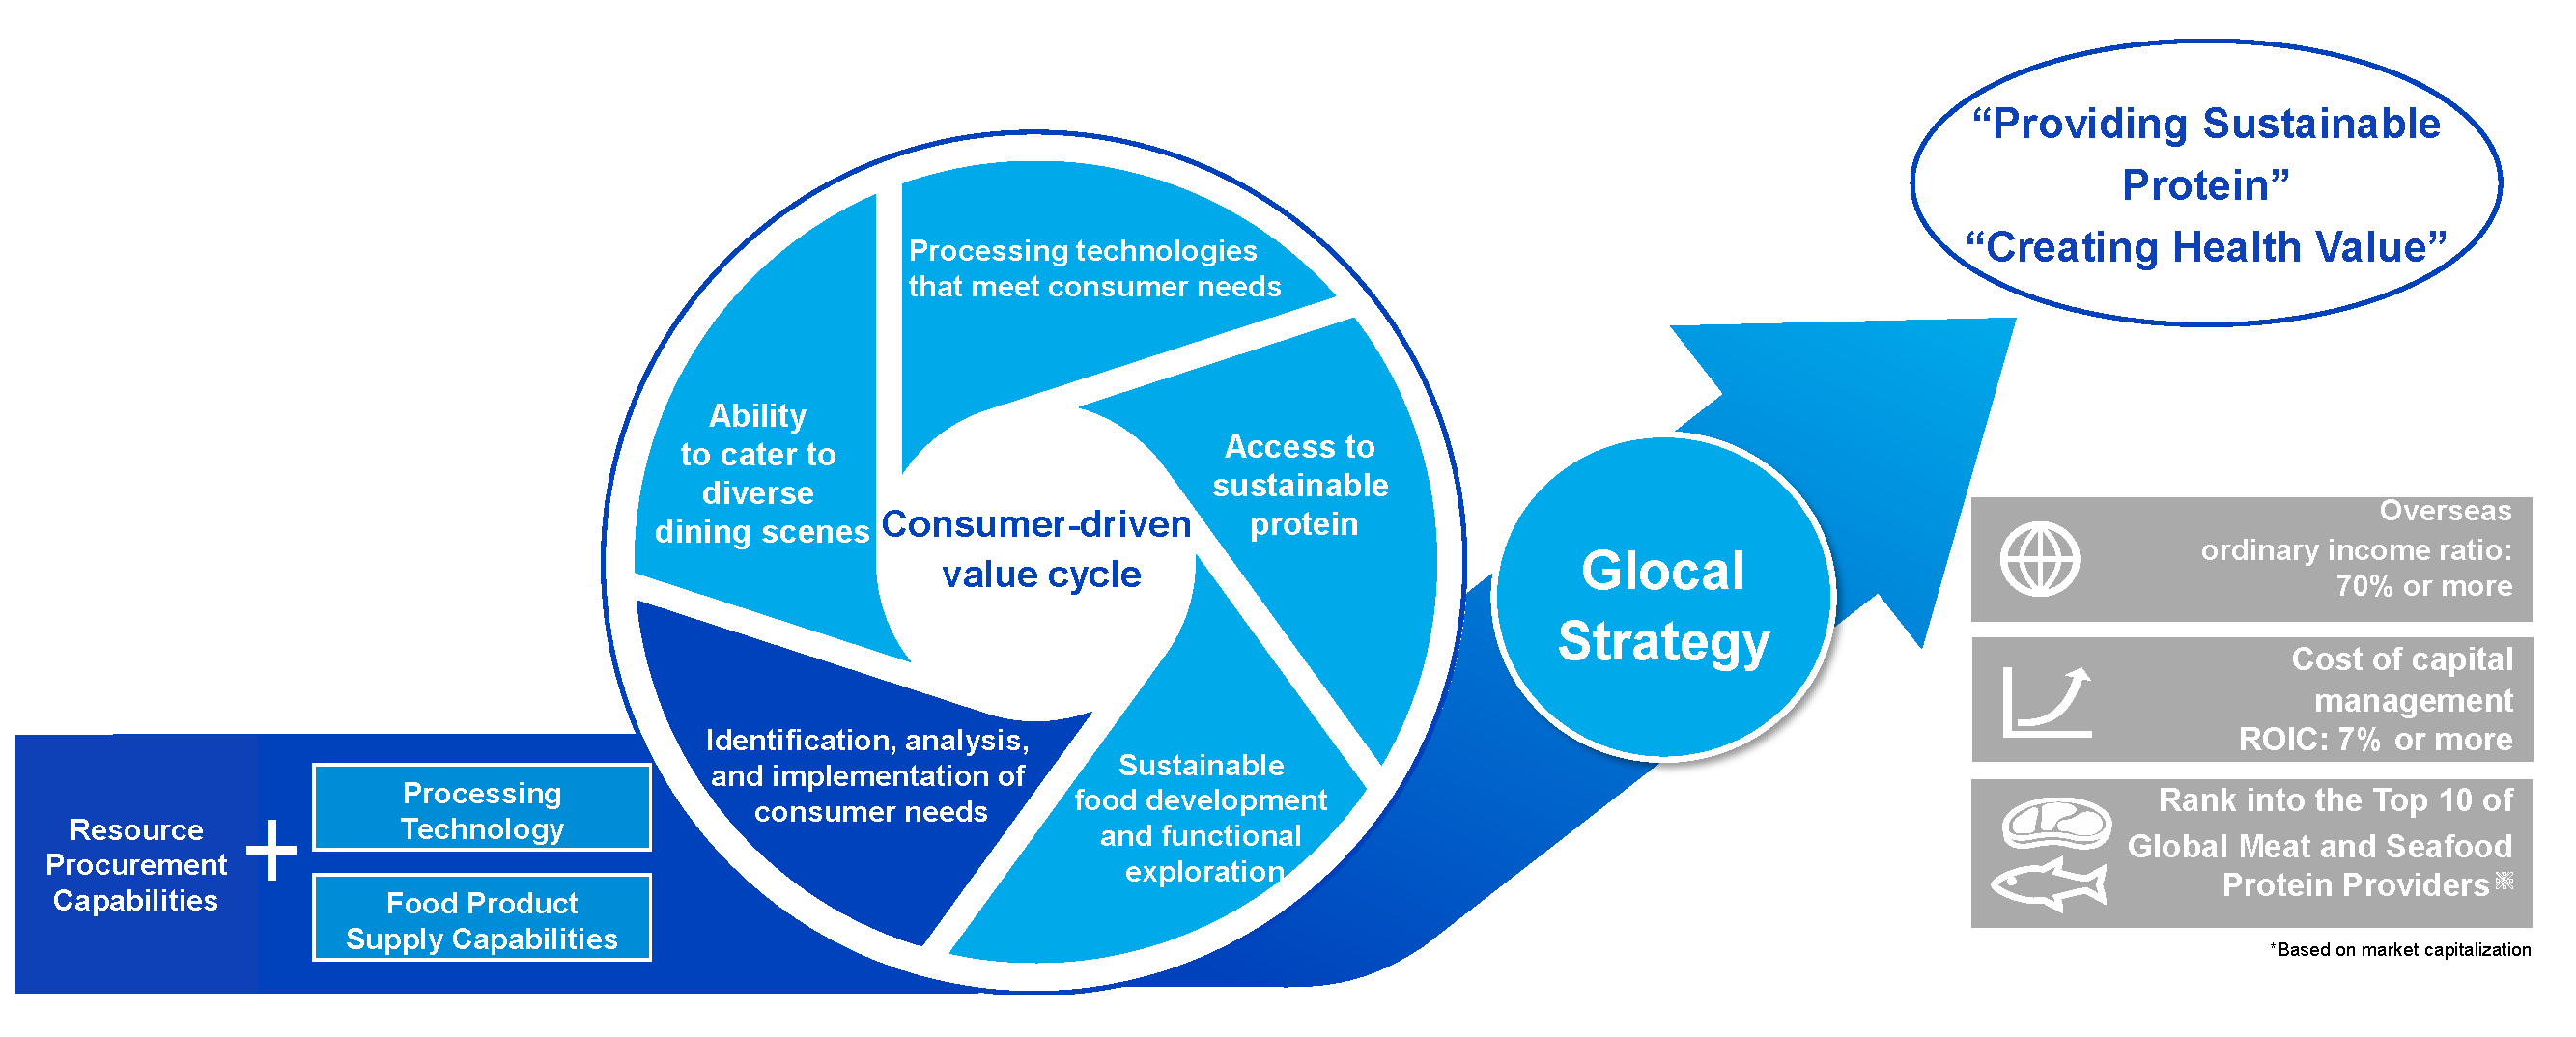
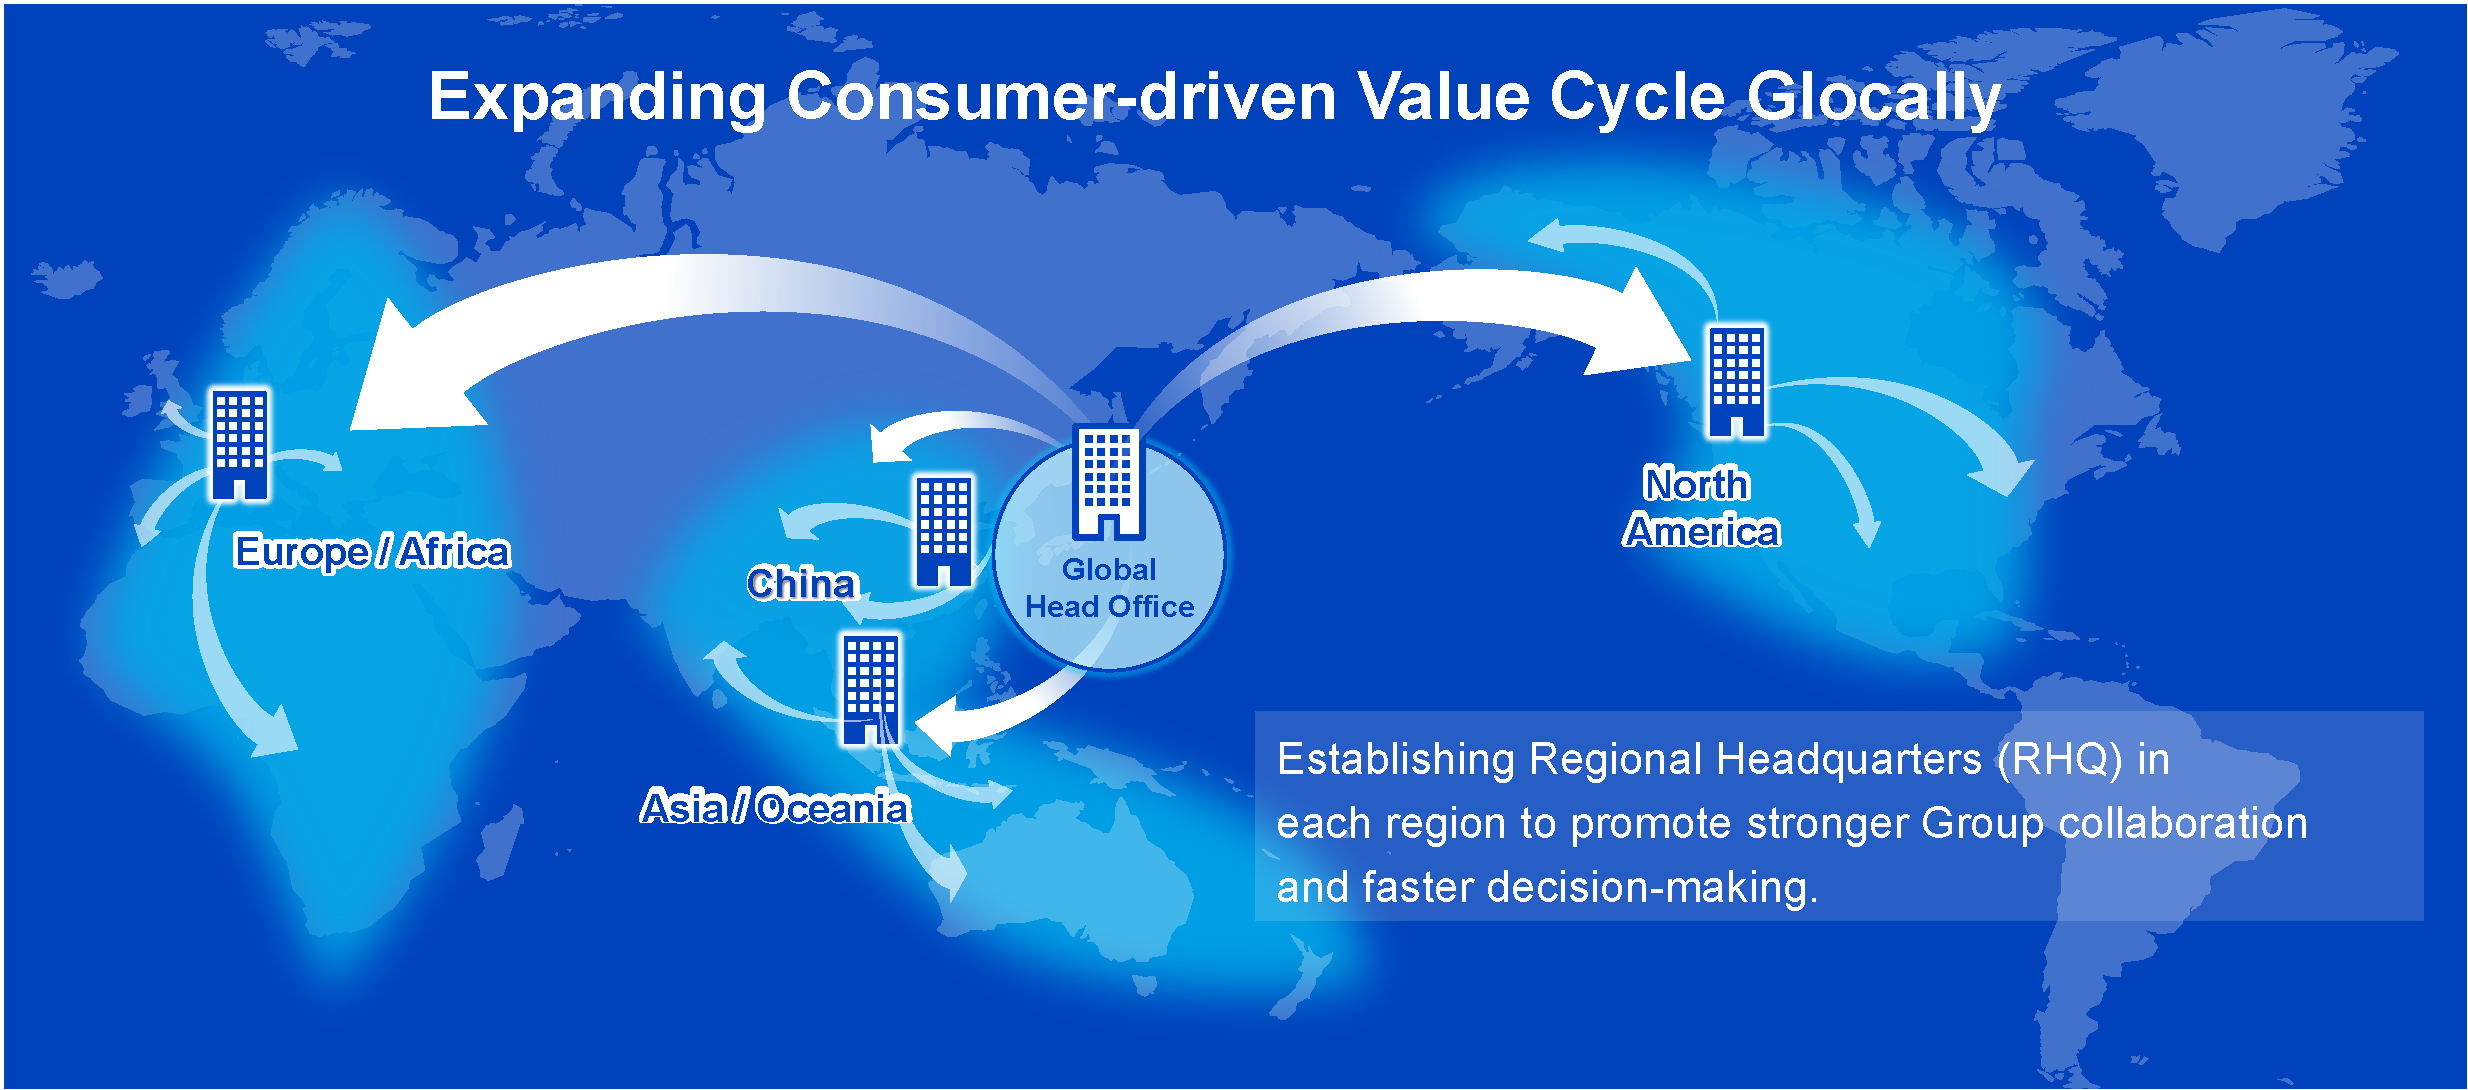
Building upon our source of strength and foundation of resource procurement capabilities, processing technology, and food product supply capabilities, we aim to expand the "value cycle" framework in a "glocal" manner, connecting businesses and functions.
Through this, we will create our Group's unique added value in the form of "providing sustainable protein" and "creating health value" over the mid- to long-term, thereby maximizing corporate value.
Quantitative Targets for the Next 10 Years
- Overseas Ordinary Income Ratio: 70% or more
- ROIC: 7% or more
- Global Meat and Seafood Protein Provider TOP 10 (based on market capitalization)
New Long-Term Vision for the Next 10 Years
- Build and strengthen a value cycle that enables consumer-driven sustainable value creation
- Maximize value creation through the glocal expansion of the value cycle
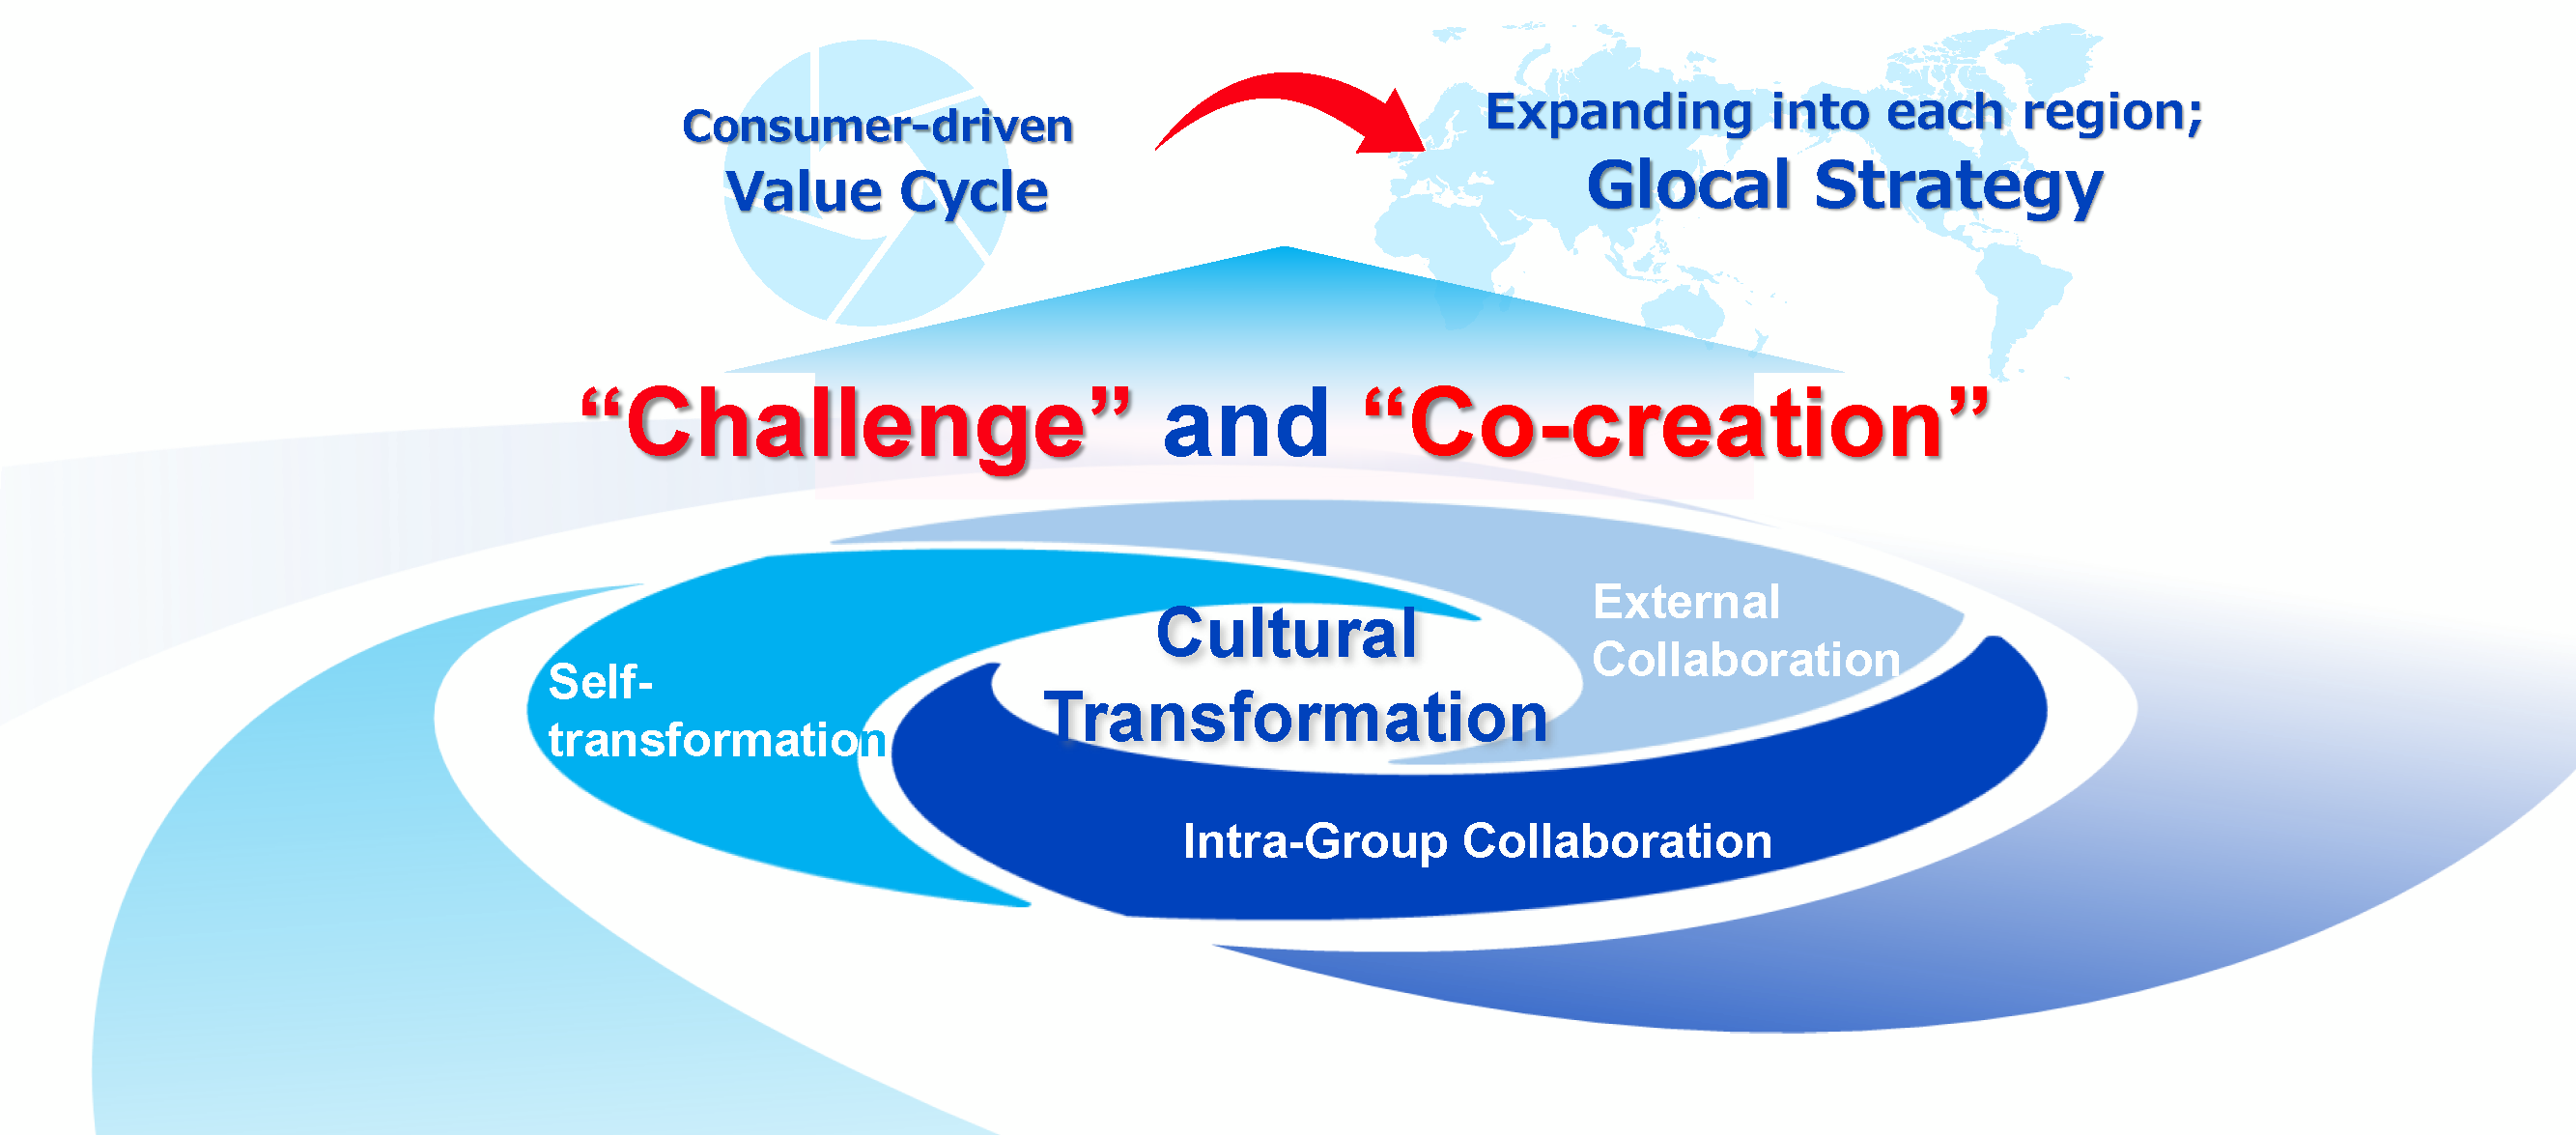
- Foster a culture of "challenge" and "co-creation" that supports value creation
Mid-term Management Plan
"For the ocean, for life 2027"
Enhance corporate value by building a value cycle and promoting a glocal strategy, generating stable cash, improving profitability and capital efficiency, making proactive investments for growth, and enhancing shareholder returns while maintaining an appropriate financial balance.
Financial KGIs
■Company-wide Financial KGIs
| FY Ending March 2025 Result | FY Ending March 2028 Plan | |
|---|---|---|
| UmEV*1 | 5.9 bln.JPY*2 | 9 bln.JPY |
| Operating income | 30.4 bln.JPY | 40 bln.JPY |
| Overseas ordinary income ratio | 44% | 54% |
| EBITDA | 51.6 bln.JPY | 64 bln.JPY |
| ROIC | 4.3% | 5% |
| ROE | 10.7% | 9% |
| Net D/E ratio | 1.0x | 1.0x |
[ Cost of Capital ]
Cost of equity based on CAPM formula is 5.3-7.5%
WACC is around 4%
*1 Umios Economic Value: (ROIC − WACC) × Invested Capital
*2 Recalculated using the assumed WACC for FY 2027
■KGIs by Segment
| Segment | FY Ending March 2025 Result |
FY Ending March 2028 Plan |
|
|---|---|---|---|
| Operating Income | Operating Income | ||
| Marine Resources Business | Japan | -3.3 bln.JPY | 0.6 bln.JPY |
| Overseas | -1.5 bln.JPY | 4.6 bln.JPY | |
| subtotal | -4.8 bln.JPY | 5.2 bln.JPY | |
| ROIC | ー | 3.8% | |
| Foodstuff Distribution Business | Japan | 12.8 bln.JPY | 13.0 bln.JPY |
| Overseas | 5.8 bln.JPY | 7.5 bln.JPY | |
| subtotal | 18.6 bln.JPY | 20.5 bln.JPY | |
| ROIC | 4.8% | 5.5% | |
| Processed Foods Business | Japan | 5.5 bln.JPY | 6.2 bln.JPY |
| Overseas | 8.8 bln.JPY | 9.6 bln.JPY | |
| subtotal | 14.3 bln.JPY | 15.8 bln.JPY | |
| ROIC | 8.9% | 8.8% | |
| Others | subtotal | 1.9 bln.JPY | -1.5 bln.JPY |
| Total | Japan | 15.8 bln.JPY | 18.3 bln.JPY |
| Overseas | 14.2 bln.JPY | 21.7 bln.JPY | |
| total | 30.0 bln.JPY | 40.0 bln.JPY | |
| ROIC | 4.3% | 5.0% | |
■Segment-specific Business Strategy
| Marine Resources Business Segment |
|
|---|---|
| Foodstuff Distribution Business Segment |
|
| Processed Foods Business Segment |
|
▶Learn more about our business strategies by business segment (PDF: 2.99 MB / 33 p)
5% ROIC Target
- Initiatives contributing to both the numerator and denominator are underway toward achieving ROIC of 5%, surpassing WACC of 4%.
| Mar/26 Result | Mar/27 Plan | Final Year of MTP Mar/28 Target |
Estimated Contribution | |
| ROIC* (Consolidated) |
4.1% | 4.3% | 5.0% | Mar/26 vs Mar/28 (+0.9pt) |
| Contribution to the Numerator (Profit Growth) |
 Improvement in Operating Income Margin (Mar/26: 2.8% Mar/27 Plan: 3.5%) |
+0.7pt |
||
 Business Expansion through M&A |
Mainly contributes to the next MTP |
|||
| Contribution to the Denominator (Asset optimization) |
 Compression of working capital through inventory management. Accounts receivable reduction across all businesses (shortening CCC) |
+0.1pt |
||
 Sale of cross-shareholdings and real estate, and transfer of shares in logistics subsidiary, etc. |
+0.1pt |
|||
*ROIC formula = Ordinary Income (after tax and before interest payments) ÷ Invested Capital (Working Capital + Fixed Assets)
■Segment-specific Measures to Improve ROIC
| Marine Resources | |||
|---|---|---|---|
| Mar/26 | Mar/27 Plan |
Mar/28 Target |
|
| ROIC | 2.0% | 2.6% | 3.8% |
| Mar/26 Initiatives |
Structural Reform
Fishery :Withdrawal from unprofitable businesses
Aquaculture:High water temperature countermeasures North America:Consolidation of production sites |
| Outlook |
Structural Reform &
Sales Enhancement
Fishery:Continued withdrawal from unprofitable businesses
Aquaculture:Strengthening production systems North America:Production cost reduction and sales enhancement |
| Foodstuff Distribution | ||
|---|---|---|
| Mar/26 | Mar/27 Plan |
Mar/28 Target |
| 4.7% | 5.1% | 5.5% |
|
Business Expansion & Collaboration Enhancement
|
|
Business Expansion & Collaboration Enhancement
Europe:
(1) Expansion of business domain (2) Strengthening downstream operations through Marine Resources + Foodstuff Distribution collaboration Japan:Strengthened collaboration between wholesale business and Foodstuff Distribution Business |
| Processed Foods | ||
|---|---|---|
| Mar/26 | Mar/27 Plan |
Mar/28 Target |
| 7.3% | 7.4% | 8.8% |
|
Sales Expansion
|
|
Structural Reform & Business Expansion
|
Capital Allocation Policy
- Reduction of cross-shareholdings
- Sale of owned real estate
- Transfer of shares in logistics subsidiary, etc.
Cash-in Amount
FY2025 + FY2026 Combined: approx. 50.0 bln.JPY
(FY2025 Result: 16.5 bln.JPY)
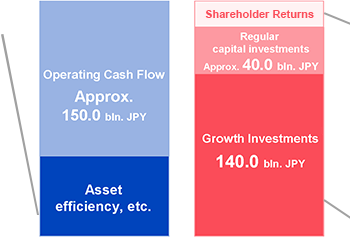
Shareholder Returns: 20.0 bln. yen or more
Pet Food Business Enhancement : 18%
▶Learn more about our growth investments (PDF: 1.98 MB / 39 p)
▶Learn more about our shareholder returns